世界消费类别与人口分布-雅思写作饼状图pie chart-雅思小作文范文 world spending and consumption
这篇雅思写作小作文要求大家描述世界范围内不同类别支出所占的比例,以及世界人口的分布和他们所消耗的资源。从图中我们可以看出,食物占世界人口指出的主要部分,而虽然居住在美洲和欧洲的人口比例不大,他们所消耗的资源却占到世界一半以上。老烤鸭小编搜集了一篇相关的高分范文,以供大家参考。
雅思写作小作文题目
The pie charts below give data on the spending and consumption of resources by countries of the world and how the population is distributed.
Summarise the information by selecting and reporting the main features, and make comparisons where relevant.
雅思写作小作文范文
The given pie charts show data on world population, the spending of people in basic needs and their share of resource consumption.
饼状图展示了有关世界人口,人群的基本需求支出及其在资源消耗中所占份额的数据。
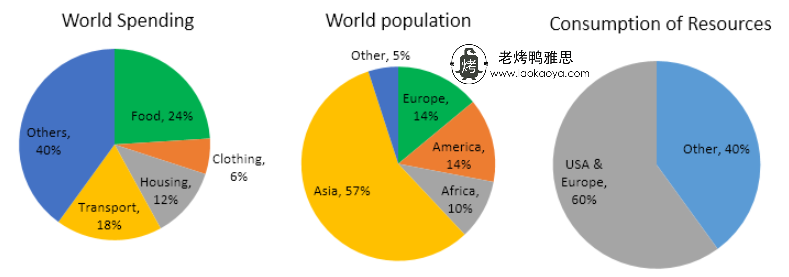
As is presented in the graph, people of the world spent most of their amount on their foods and more than half of the population lives in Asia whereas more than half of the resources are consumed by the USA and European people.
如图所示,全世界人民大部分金钱用于购买食物,有一半以上的人口生活在亚洲,而欧洲和美国则消耗了一半以上的资源。
According to the first pie chart, people of the world on an average spent 24% on foods. In clothing, they spent 6% while this percentage is double for housing and triple for the transport. This article is from Laokaoya website. The remaining 40% is the combination of other categories for spending.
根据第一个饼图,世界上人们平均在食品上花费24%的收入。在服装上,他们花费6%。在住房上的花费是该数据的两倍,运输上的花费是该数据的三倍。其余40%是其他类别的支出组合。
The second pie chart shows that more than half of the world populations live in Asia continent while Europe & America have both only 14% of the total population. One-tenth of the world population lives in Africa and the rest of the 5% of people live in other places in the world.
第二个饼图显示,世界上一半以上的人口居住在亚洲大陆,而欧洲和美洲均仅占总人口的14%。世界人口的十分之一居住在非洲,其余5%的人口居住在世界其他地方。
Finally, the third pie chart shows that 60% of world resources are consumed by the population of the USA and Europe, though their percentage is only 28% in total. The remaining 40% of resources are shared among the rest of the 72% world population of other regions of the world.
最后,第三幅饼图显示,尽管美国和欧洲的人口消耗了60%的世界资源,但他们所占的百分比仅为28%。世界上剩余72%的人口共享剩下的40%的资源。
点击查看更多雅思写作小作文高分范文,快速提升写作成绩


世界消费类别与人口分布-雅思写作饼状图pie chart-雅思小作文范文 world spending and consumption:等您坐沙发呢!