雅思写作小作文范文 雅思写作折线图(线状图) 老年人口比例
今天我们雅思写作小作文范文的文章来研究下折线图(线状图)。该图表展示了美国、日本、瑞典这三个国家中65岁以上人口所占的比例,以及他们从1940年到2040年期间的变化。老烤鸭小编搜集了一篇相应的考官范文,以供大家参考。
雅思写作小作文题目
The graph below shows the proportion of the population aged 65 and over between 1940 and 2040 in three different countries.
Summarise the information by selecting and reporting the main features, and make comparisons where relevant.
雅思写作小作文范文
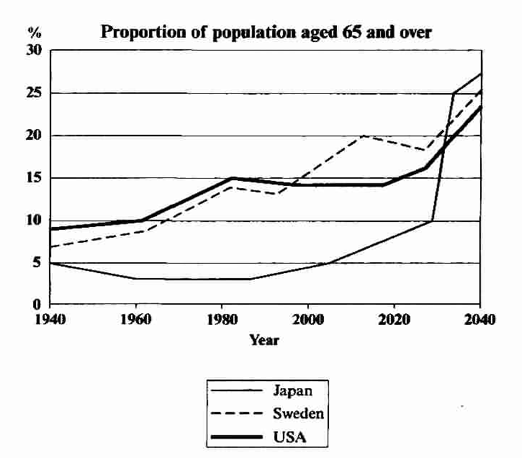
The line graph compares the percentage of people aged 65 or more in three countries over a period of 100 years.
线状图比较了一百年的十年里三个国家65岁以上人口的比例。
It is clear that the proportion of elderly people increases in each country between 1940 and 2040. Japan is expected to see the most dramatic changes in its elderly population.
很明显,在1940年到2040年期间,每个国家老年人的比例都在上升。其中,日本的老年人口上升最为迅速。
In 1940, around 9% of Americans were aged 65 or over, compared to about 7% of Swedish people and 5% of Japanese people. The proportions of elderly people in the USA and Sweden rose gradually over the next 50 years, reaching just under 15% in 1990. By contrast, the figures for Japan remained below 5% until the early 2000s.
1940年,大约百分之九的美国人年龄在65岁以上,瑞典的数据为百分之七,日本的数据为百分之五。在接下来的50年里,美国和瑞典的老年人口比例逐渐上升。在1990年的时候几乎达到百分之十五。相比之下,直到21世纪初,日本的数据保持在百分之五以下。
Looking into the future, a sudden increase in the percentage of elderly people is predicted for Japan, with a jump of over 15% in just 10 years from 2030 to 2040. By 2040, it is thought that around 27% of the Japanese population will be 65 years old or more, while the figures for Sweden and the USA will be slightly lower, at about 25% and 23% respectively.
看向未来,日本的老年人口比例预计会有突然的上升。在2030年到2040年这10年间会上升超过15个百分点。到2040年,预计百分之二十七左右的日本人口年龄在65岁以上。而瑞典和美国的数据会稍微低一些,分别为百分之二十五和百分之二十三。
点击查看雅思写作小作文高分范文,快速提升写作成绩