雅思写作小作文范文 雅思写作柱状图bar chart 房价变化
今天我们雅思写作小作文范文的文章来研究下柱状图bar chart。该图表展示了纽约、马德里、东京、法兰克福以及伦敦这五个城市房价从1990年到2002年的变化。与一般柱状图不同的是,它并没有给出具体的数字,而是显示了与1989年价格相比的变化比率。老烤鸭小编搜集了一篇相应的考官范文,以供大家参考。
雅思写作小作文题目
The chart below shows information about changes in average house prices in five different cities between 1990 and 2002 compared with the average house prices in 1989.
Summarise the information by selecting and reporting the main features, and make comparisons where relevant.
雅思写作小作文范文
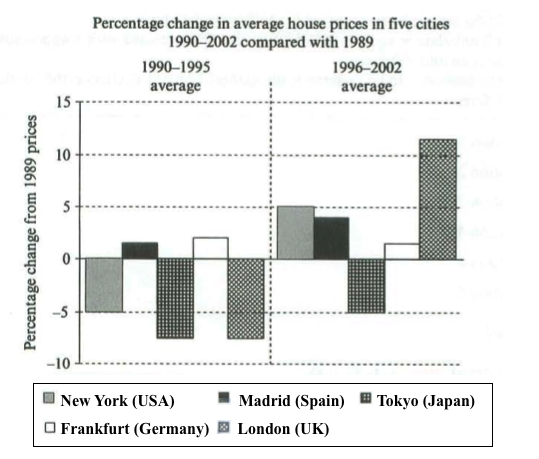
The bar chart compares the cost of an average house in five major cities over a period of 13 years from 1989.
柱状图比较了从1989年开始的13年里5个主要城市平均房价的变化。
We can see that house prices fell overall between 1990 and 1995, but most of the cities saw rising prices between 1996 and 2002. London experienced by far the greatest changes in house prices over the 13-year period.
我们可以看到在1990年和1995年间房价整体下降。但大多数城市的房价在1996年到2002年期间有所上升。伦敦的房价在这13年的时间里经历了到目前为止最大的变化。
Over the 5 years after 1989, the cost of average homes in Tokyo and London dropped by around 7%, while New York house prices went down by 5%. By contrast, prices rose by approximately 2% in both Madrid and Frankfurt.
在1989年之后的5年里,东京和伦敦的平均房价下降了大约百分之7,而纽约的房价则下降了百分之5。相比之下,马德里和法兰克福的价格则上升了大约百分之2。
Between 1996 and 2002, London house prices jumped to around 12% above the 1989 average. Homebuyers in New York also had to pay significantly more, with prices rising to 5% above the 1989 average, but homes in Tokyo remained cheaper than they were in 1989. The cost of an average home in Madrid rose by a further 2%, while prices in Frankfurt remained stable.
在1996年和2002年间,伦敦的平均房价相比于1989年上涨了大约百分之12。纽约的购房者同样支付了更高的价钱。房价与1989年的平均水平相比上升了百分之5。但是东京的房子与1989年比起来要便宜一些。马德里的平均房价进一步上涨了百分之2,而法兰克福的价格则基本保持稳定。