雅思写作小作文范文 雅思写作折线图(线状图) 酸雨
今天我们雅思写作小作文范文的文章来研究下折线图(线状图)。该图表展示了从1990年到2007年英国四个部门的酸雨排放量。单位为百万吨。四个部门分别为:交通与通勤部门,电力、燃气以及水利供应部门,家庭以及其他产业部门。老烤鸭小编搜了一篇相应的考官范文,以供大家参考。
雅思写作小作文题目
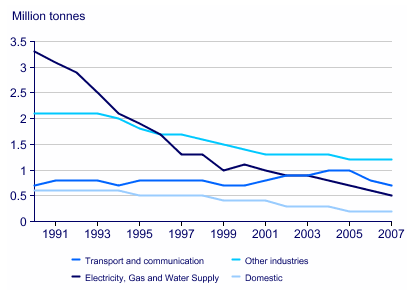
The graph below shows UK acid rain emissions, measured in millions of tonnes, from four different sectors between 1990 and 2007.
Summarise the information by selecting and reporting the main features, and make comparisons where relevant.
雅思写作小作文范文
The line graph compares four sectors in terms of the amount of acid rain emissions that they produced over a period of 17 years in the UK.
折线图比较了英国四个部门在17年间排放的酸雨数量。
It is clear that the total amount of acid rain emissions in the UK fell considerably between 1990 and 2007. The most dramatic decrease was seen in the electricity, gas and water supply sector.
很明显,英国的整体酸雨排放量在1990年到2007年之间显著下降。下降幅度最大的是电力、燃气以及水利供应部门。
In 1990, around 3.3 million tonnes of acid rain emissions came from the electricity, gas and water sector. The transport and communication sector was responsible for about 0.7 million tonnes of emissions, while the domestic sector produced around 0.6 million tonnes. Just over 2 million tonnes of acid rain gases came from other industries.
1990年,大约330万吨的酸雨排放量来自电力、燃气和水利部门。交通和通勤部分产生了大约70万吨的排放,而家庭的排放量则大约为60万吨。只有2万多吨的酸雨气体来自其他工业部分。
Emissions from electricity, gas and water supply fell dramatically to only 0.5 million tonnes in 2007, a drop of almost 3 million tonnes. While acid rain gases from the domestic sector and other industries fell gradually, the transport sector saw a small increase in emissions, reaching a peak of 1 million tonnes in 2005.
2007年,电力、燃气和水利部门的排放急剧下降到50万吨,几乎减少了300万吨。虽然家庭和其他产业的酸雨气体逐渐下降,但交通部门的排放量小幅上升。在2005年达到100万吨的顶点。
点击查看雅思写作小作文高分范文,快速提升写作成绩