雅思写作小作文范文 雅思写作折线图(线状图) 迪拜黄金销量
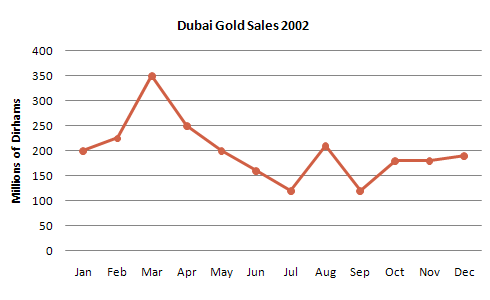
今天我们雅思写作小作文范文的文章来研究下折线图(线状图)。该图表给出了2002年迪拜黄金在12个月里的销售数据。单位为百万迪拉姆。图中只有一条线,结构比较简单,我们只需要注意选取最高点,最低点,相同点的数据就好。老烤鸭小编搜集了一篇相关的高分范文,以供大家参考。
雅思写作小作文题目
The line graph shows the estimated sales of gold in Dubai for 12 months in 2002 in millions of Dirhams.
Summarise the information by selecting and reporting the main features, and make comparisons where relevant.

雅思写作小作文范文
The given line graph shows data on Gold sales in Dubai from January to December of the year 2002. As is presented in the illustration, the highest amounts of sales were done in March and the lowest sales were in July and September.
上述的折线图展示了迪拜2002年从1月到12月黄金销量的相关数据。正如图中所呈现的那样,最高的销售数据出现在三月,而最低的销售数据则出现在7月和9月。
As is presented in the line graph, initially in January 2002, two hundred millions of Dirham Gold was sold and this amount kept increasing for the next two month and in March it reached to 350 million which is the largest amount throughout the whole year. After that, this translation is from Laokaoya website, the sales volume keeps declining steadily and reached 110 million in July. With some fluctuations, the sale amount reached 200 million in August and finally, in December, it totaled about 200 million.
正如折线图中所给出的那样,在2002年初的1月份,两亿迪拉姆的黄金被出售。这一数字在接下来的两个月里持续上升,并且在三月份的时候达到三亿五千万。这是一整年里的最高数字。在那之后,销售量持续稳定下降,并且在7月份的时候到达一亿一千万。在经历了一些波动之后,销量在八月份达到两亿。在12月的时候,它再次达到亿。
In summary, Mars was the best month for Dubai Gold sales in the year 2002 and throughout the year the sale volume fluctuated keeping an approximate average of 180 million Dirham per month.
总的来说,三月是2002年迪拜黄金销售的最佳月份。一整年里,销量数据持续波动,平均值大约为每月1亿8千万迪拉姆。


