雅思写作小作文范文 雅思写作折线图(线状图) 美国肉类消耗量
今天我们雅思写作小作文范文的文章来研究下折线图(线状图)。该图表来自于华盛顿邮报的网站,数据相对于真正的雅思考试而言要更多一些。因此如何挑选数据和进行对比就显得尤为重要。老烤鸭小编搜集了一篇考官写的范文,以供大家参考。
雅思写作小作文题目
雅思写作小作文范文
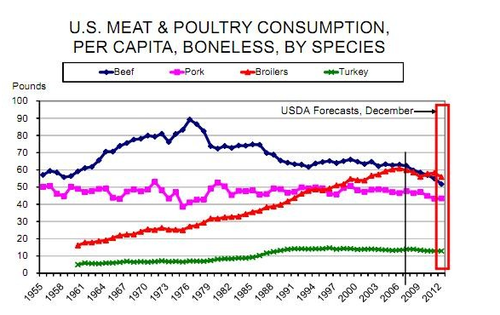
The line graph shows changes in the per capita consumption of beef, pork, broilers, and turkey in the United States between 1955 and 2012.
该折线图展示了1955年到2012年期间美国每人牛肉、猪肉、鸡肉和火鸡肉的消耗量。
It is noticeable that beef was by far the most popular of the four types of meat for the majority of the 57-year period. However, a considerable rise can be seen in the consumption of broilers, with figures eventually surpassing those for beef.
很显然,牛肉在57年中的大多数时间都是四种肉类中最受欢迎的类型。然而,鸡肉的消费量可以看到明显上升,并最终超过了牛肉的数量。
Between 1955 and 1976, US beef consumption rose from around 60 to a peak of 90 pounds per person per year. During the same period, consumption of broilers also rose, to nearly 30 pounds per person, while the figures for pork fluctuated between 50 and 40 pounds per person. Turkey was by far the least popular meat, with figures below 10 pounds per capita each year.
在1955年到1976年期间,美国牛肉的消耗量从每人每年60磅,上涨到最高点每人每年90磅。在同样的时间段里,鸡肉的消费量也在上升,到达将近每人30磅。而猪肉的消费量则在每人50磅到40磅之间徘徊。火鸡肉到目前为止是最不受欢迎的肉类,每年每人的消耗量低于10磅。
By 2012, the amount of beef consumed by the average American had plummeted to around 50 pounds, but the consumption of broilers had doubled since the 1970s, to approximately 55 pounds per capita. By contrast, there were no significant changes in the trends for pork and turkey consumption over the period as a whole.
到2012年,平均每位美国人牛肉的消耗量跌落到大约50磅,但是鸡肉的消费量上涨到了20世纪70年代的两倍,到达大约每人55磅。相比之下,猪肉和火鸡肉的消费类在整个时间段内没有太大的变化趋势。
点击查看雅思写作小作文高分范文,快速提升写作成绩