小麦出口-雅思写作折线图(线状图)-雅思小作文范文 wheat exports
这篇雅思写作小作文要求大家比较1985年至1990年之间,澳大利亚、加拿大和欧盟这三个地区小麦出口量的变化。从图中我们可以看出,只有欧盟的出口量在这一时间段内有所上升,其他两个国家的出口量都略微下降。老烤鸭小编搜集了一篇相关的高分范文,以供大家参考。
雅思写作小作文题目
The graph below shows the differences in wheat exports over three different areas.
Summarise the information by selecting and reporting the main features, and make comparisons where relevant.
雅思写作小作文范文
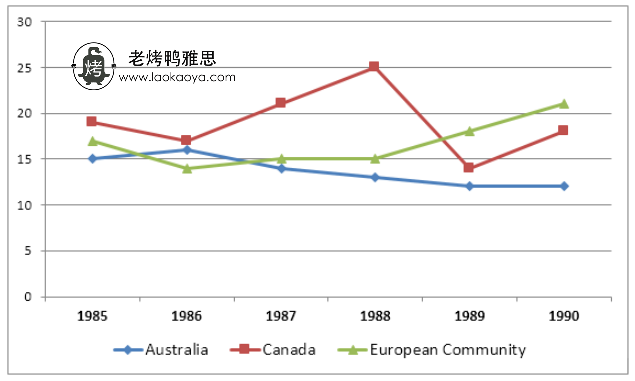
The line graph compares the quantity of wheat Australia, Canada, and the European Community exported between 1985 and 1990. Overall, the European Union’s wheat shipping increased over the time while Australia experienced a downward trend in its wheat trading. Although wheat exports of the three given areas have fluctuated, Canada had the most noticeable oscillations throughout the given period.
折线图比较了1985年至1990年之间澳大利亚,加拿大和欧洲共同体的小麦出口量。总体而言,欧盟的小麦运输量随时间增加,而澳大利亚的小麦贸易则呈下降趋势。尽管三个特定地区的小麦出口都有波动,但加拿大在整个特定时期的波动最为明显。
The European Union exported approximately 17.5 million tonnes of wheat in 1985 and the export fell below 15 million tonnes in the following year. Then, this article is from Laokaoya website, it increased to 15 million tonnes in the subsequent year and remained steady in 1988. EU’s wheat export surged in the next two years and in 1990 their wheat export was more than 20 million tonnes.
1985年,欧盟出口了约1750万吨小麦,第二年出口量下降到1500万吨以下。随后一年又增至1500万吨,并在1988年保持稳定。在接下来的两年中,欧盟的小麦出口激增,1990年,其小麦出口量超过2000万吨。
On the other hand, Australia’s wheat export in 1985 was the lowest, 15 million tonnes, among the given three regions. In the year that followed, the export improved with at least 1 million tonnes before it continuously declined in the subsequent years, hitting the lowest wheat export figure as little as 12 million tonnes in 1990.
另一方面,在上述三个地区中,澳大利亚1985年的小麦出口量最低,为1500万吨。在随后的一年中,出口量至少增加了100万吨,此后它在随后的几年中持续下降,在1990年的创下最低小麦出口量,仅为1200万吨。
Canada’s wheat export was the highest of the three given regions in 1985 with nearly 20 million tonnes. Next year, it decreased to about 17 million tonnes before it significantly increased in the following two years, reaching 25 million tonnes in 1988, the highest. However, in 1989, it plunged to around 5 million tones below its initial wheat exports figure in 1985 and settled to 20 million tones and the end of the period.
1985年,加拿大的小麦出口量是三个地区中最高的,接近2000万吨。第二年,它减少到大约1700万吨,然后在随后的两年中显着增加,到1988年时达到最高的2500万吨。但是,到1989年,小麦出口量比1985年最初的小麦出口量下降了约500万吨,并在此期间结束时降至2000万吨。
点击查看更多雅思写作小作文高分范文,快速提升写作成绩


小麦出口-雅思写作折线图(线状图)-雅思小作文范文 wheat exports:等您坐沙发呢!